Ranking Texas gerrymanders

Photo by Todd Wiseman
In 2003, Texas House Democrats fled to Ardmore, Oklahoma for four days in order to scuttle Republican plans to replace the state’s court-drawn congressional map with one of their own. A few months later, Senate Democrats followed suit, spending 46 days in Albuquerque to try to circumvent a special session on redistricting. Although they were ultimately unsuccessful, the episodes are remembered fondly today by Democrats as a high point of efforts to stymie Republicans hell-bent on gaining complete control of the state.
Republicans, not surprisingly, see it differently. In their eyes, the 2001 map was indefensible, locking in much of the Democratic advantage from an aggressive 1991 gerrymander that the Almanac of American Politics called one of the “shrewdest” gerrymanders of the 1990s. Indeed, under the court’s 2001 map, Democrats still enjoyed a 17-15 advantage in the state’s congressional delegation despite the court’s creation of two new Republican seats.
Battles over the mid-decade map ultimately went to the U.S. Supreme Court, where, in 2006, the high court considered but rejected claims that the Republican redraw of the map was an unconstitutional partisan gerrymander.
Fast forward a decade and allegations are once again being made of partisan overreach.
But the good news is that this time, increasingly robust diagnostic tools give us more insight than ever into when something is going amiss and help us sort through the “he said/she said” nature of fights over excessive partisanship. And they add some important details to the Texas story.
To start, Democrats don’t have much of a leg to stand on when they claim to be the victims in the 2003 mid-decade redistricting, at least when it comes to claims of excessive partisanship (claims about racial fairness are a different matter). According to a Brennan Center analysis, Democrats received an additional 3.76 seats in Congress. in the election of November 2002 over neutrally drawn maps using a measure of partisan bias known as the efficiency gap. In short, they got almost four more seats than they were due. That bump is significant and stands out, given not only the Republican lean of the state but the fact that the 2002 election took place during a burst of post-9/11 patriotic fervor with a popular Republican president from Texas in office. The 2001 court-drawn map fares similarly poorly under other measures of partisan fairness.
But if the court map favored Democrats, there is evidence that Republicans also sought to do a bit of gerrymandering themselves, replacing a map with still high Democratic bias with a map with medium Republican bias. Under the 2003 map, Republicans received an average of 1.61 additional seats in the 2004 to 2010 elections, over what they would have gotten in a map with no bias. (The plan was modified slightly by courts for the 2006-2010 elections.)

Texas Republicans went much further this decade, however. The most recent round of redistricting took place on the heels of what — even by Texas standards — was a remarkable, decade-long growth spurt. Between 2000 and 2010, Texas was by far the fastest-growing state in the U.S., adding 4.3 million new people and gaining four new congressional seats with reapportionment.
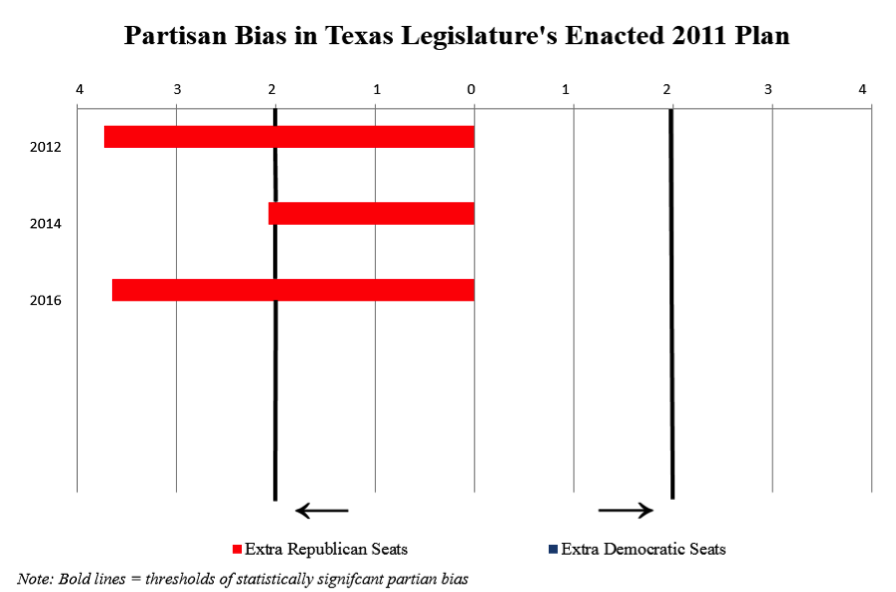
When it came time to redraw the map, Texas Republicans this time threw caution to the wind — passing a map in 2011 that would have awarded the GOP with almost four extra seats in the elections of both 2012 and 2016 had it not been modified by a federal court.

But that’s not the end of the story. The same diagnostic tools that let us detect extreme gerrymanders like Texas’ also help shed light on how Texas Republicans artfully engineered a massive artificial advantage by disadvantaging the Latino and African-American voters who accounted for nearly 90 percent of the state’s population gain between 2000 and 2010. Indeed, the state’s original congressional plan did not add a single net African-American or Latino seat despite the unprecedented growth of those communities. It instead packed as many African-American voters as possible into a handful of districts, and spread Latino and other African-American voters out among as many white-majority districts as possible, ensuring that Republicans were able to engineer a large edge.
And while partisan gerrymandering claims aren’t currently in play before the three-judge federal court hearing the current round of Texas redistricting litigation, it turns out they might not need to be.
Unlike the 2003 map, which in part targeted white Democrats to gain an edge, the partisan advantage in this decade’s map comes almost exclusively from treatment of minority voters. Fixing the map to undo the underrepresentation of Latinos and African Americans goes a long way in also fixing problems of partisan bias. For example, when the court redrew Texas’ legislatively drawn map, creating a second majority-minority congressional district in the Dallas-Fort Worth area and tweaking the boundaries of TX-23 to remedy Latino vote dilution, it significantly reduced levels of partisan bias. Even so, Texas continues to have some of the most biased maps in the country, with Republicans enjoying an average advantage of around 1.87 seats in the first three elections of the decade.
A more complete fix of the cracking and packing of minority communities would improve the maps. A plan drawn in 2011 by the Texas Latino Redistricting Task Force would have reduced the bias to under one seat in each of the elections since 2012. And a demonstration plan (Plan C286) offered by State Rep. Eddie Rodriguez, D-Austin, in the current round of redistricting litigation, would have had a pro-Republican bias of just 0.08 seats in 2012 and 2016 and pro-Democratic bias of 0.59 seats in 2014.

In short, in a state where voting is increasingly polarized by race, racial and partisan bias are often joined at the hip. Fixing one generally also will fix the other.


